Trading Tesla and the S&P 500 on a Crypto Exchange? How to Read the Tokenized Stocks Page
Columns · · Satoshi Note Editorial
Read in: 한국어
On a crypto exchange you can trade SK hynix, Google, the S&P 500 and WTI crude. The price you see there can differ from the price in the stock market.
Satoshi Note has a Tokenized Stocks page under Settings › Tools (beta).
As of October 30, 2026, it listed 120 live markets, about $4.82B in 24-hour volume and $3.84B in open interest.
What do these numbers mean, and how should the table be read?
The page does not show stock prices. It shows how far prices created inside a crypto exchange have drifted from the real ones.
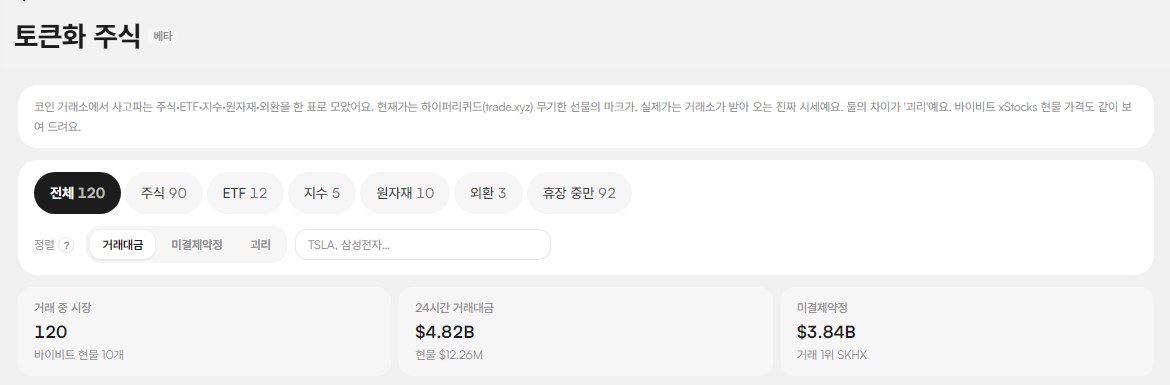
Top of the page on October 30, 2026 (shown in Korean).
1. A tokenized stock is not the stock itself
Two different things are mixed on this page.
The first is perpetual futures on Hyperliquid's trade.xyz: contracts that track stock, ETF, index, commodity and FX prices. All 120 markets are of this kind.
The second is Bybit xStocks spot: tokens that represent stocks, traded on spot. The page links 10 tickers to it.
A perpetual is a contract on a price, not ownership of the stock, so it can trade slightly away from the real price.
2. How to read the columns
Four columns are unfamiliar at first sight.
| Column | Meaning |
|---|---|
| Price | The price traded on this exchange right now (mark price) |
| Oracle | The reference price of the underlying asset the exchange uses |
| Premium | How far the price is above or below the oracle: price ÷ oracle − 1 |
| Funding/hr | What longs and shorts pay each other, per hour |
A positive premium means the exchange price is above the oracle; negative means below.
When funding is positive, longs pay shorts; when negative, the reverse.
Open interest is the total of contracts not yet closed, and 24h volume is the amount traded over a day. The Bybit spot column shows the spot price when the same ticker has one.
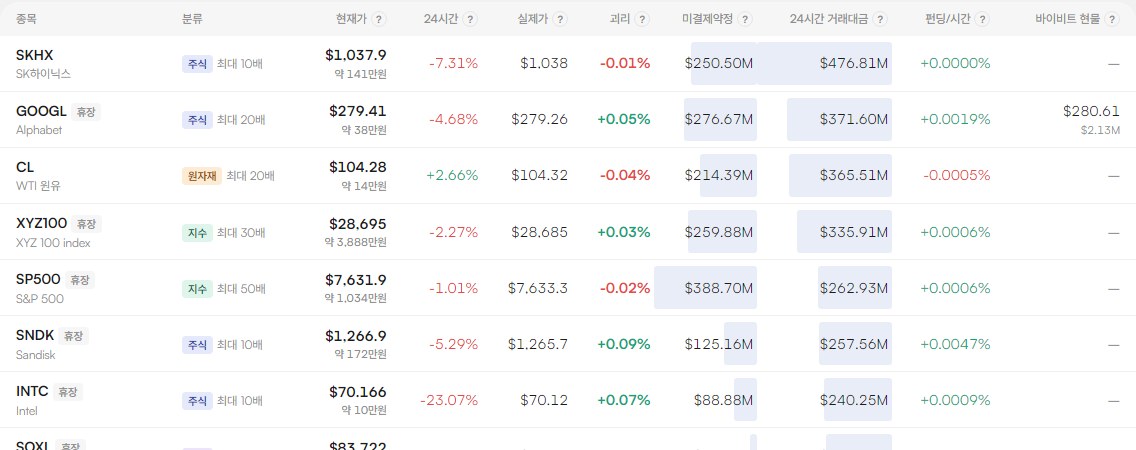
Top of the table at the same moment. A "closed" badge next to a ticker means the US session for that market is shut.
3. What the table showed at that moment
SK hynix (SKHX) at the top traded at $1,037.9, down 7.31% over 24 hours, against an oracle of $1,038, a premium of -0.01%.
Its 24-hour volume was above $470M, the largest at that time.
Google (GOOGL) carried a closed badge, at $279.41 with a +0.05% premium and a Bybit spot price of $280.61.
WTI crude (CL) traded at $104.28 with a -0.04% premium.
Premiums on the visible rows were mostly under 0.1%, meaning the perpetual was tracking the oracle closely.
These values refresh every two minutes and will differ on the live page.
4. The market map shows where the money sits
A table makes it hard to compare 120 markets by size, so the page has a market map above it.
Each tile is one market. Tile size is volume or open interest, and color can be switched to premium or funding.
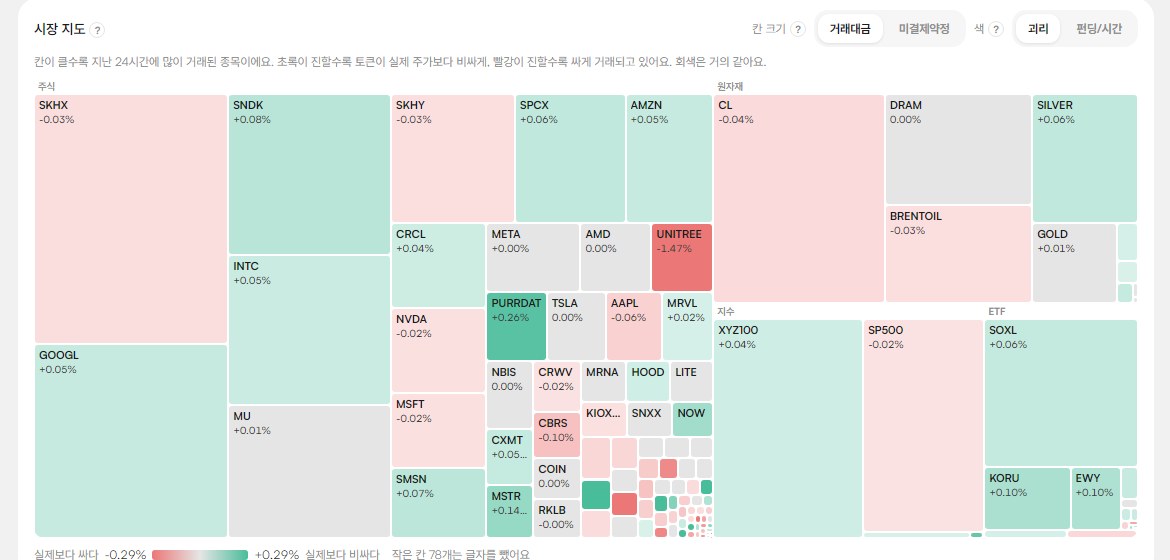
Bigger tiles mean more volume. Markets with large 24-hour drops are shown in red.
By category, stocks made up 61.5% of volume ($2.97B), commodities 18.8% ($904M), indices 12.6%, ETFs 6.9% and FX 0.3%.
On a crypto exchange, more than half of the volume comes from stocks.
5. Before you use it
Three checks reduce misreadings.
First, a large premium is not automatically an opportunity. When a market is closed the oracle does not move, so a gap can open and then narrow when the market reopens. Keep that in mind for closed markets.
Second, perpetuals carry funding costs, which add up the longer a position is held.
Third, maximum leverage differs by market. The table lists it next to the category: 10x, 20x, 50x.
The page is not a prompt to trade. It lets you see these values in one place.
Closing: look at the premium and market status before the price
Tokenized stocks let you trade stocks inside a crypto exchange, but the price has two sources.
Look at the exchange price, the oracle price and whether the market is open together.
On this table, the distance from the oracle and the closed badge are the numbers to read before the price itself.
Check it yourself in Satoshi Note
The Tokenized Stocks page opens from Settings › Tools (beta).
You can filter by category and view closed markets only. It is currently in beta.
Data basis: the Satoshi Note Tokenized Stocks page on October 30, 2026. Hyperliquid trade.xyz perpetuals and Bybit xStocks spot, refreshed every two minutes. This content is for market data analysis, not investment advice.