What Are Top Hyperliquid Traders Holding Right Now? How to Read the Asset Page
· Satoshi Note
The Satoshi Index leaderboard answers "who is doing well." The asset page answers a more specific question: for one coin, exactly who is long, who is short, and by how much. This post walks through how to read it, using ETH as the example.
Open an asset from the long/short table
From the leaderboard, the long/short-by-asset table lists every coin with open interest from top traders. Tap a row (ETH, BTC, HYPE, whatever you're watching) and the asset page opens with two sections: summary numbers at the top, then a ranked list of every individual position.

- Holding traders — how many of the top accounts hold a position in this coin at all, split long vs. short.
- Lean — two separate percentages worth distinguishing: "Traders Long 65%" counts accounts, "Amount Long 80%" counts dollars. When the two diverge like this, it means a smaller number of accounts are carrying outsized long positions — headcount alone would have understated how one-sided the book really is.
- Long · Short amount — the actual dollar size on each side.
- Total unrealized P&L — the combined paper profit or loss of every open position in this coin, at the current price.
Who holds which side — the position list
Below the summary cards is the part that answers "show me the actual accounts," sorted by position size:
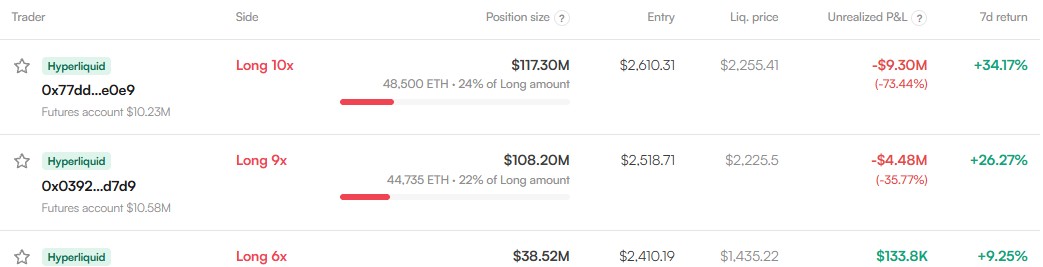
Each row is one trader's position in that coin:
- Trader — exchange tag and wallet address (truncated for readability; tap through to see that account's full position history and returns).
- Side — direction and leverage, e.g. "Long 10x."
- Position size — dollar value and the underlying amount, plus what share of all long (or short) exposure that one position represents.
- Entry and Liq. price — the price they opened at, and the price that would liquidate the position. A position with its liquidation price close to the current market price is far more exposed to a short-term move than one with room to spare.
- Unrealized P&L — paper gain or loss at the current price, in dollars and percent.
- 7d return — that account's overall 7-day performance, the same metric used to rank them on the leaderboard. This separates "sitting on a loss on this one position" from "losing money overall" — a trader can be down on a single coin while still up on their book.
How to use this, and what it isn't
This view is useful for spotting crowding (a huge share of long dollar exposure sitting in two or three accounts, for instance) or for checking whether a specific top-ranked trader is in a coin you're watching. It is not a signal to copy — these are snapshots of already-open positions from accounts that ranked well over a past window, not a prediction of what they'll do next, and past return doesn't guarantee future results.
If you'd rather not check back manually, Satoshi Note's watchlist feature lets you follow specific traders and get notified when their positions change — covered in a separate post.
Satoshi Note is free. Read-only API keys only. The site is satoshinote.io.